Regression Statistics essays and research papers
Last update: May 12, 2015-
Regression Analysis
The Factor analysis summarizes many variables by few factors and helps to understand the structure of a correlation matrix. It accounts for multi-collinearity among a large number of interrelated independent quantitative variables by grouping the variables into a few factors and reduces correlations. In our case, we have countries as the units of observations. We have data on different aspects of these countries like population, density, percentage of people living in cities, religion, life expectancy,
Rating:Essay Length: 1,667 Words / 7 PagesSubmitted: June 29, 2011 -
Research Design And Statistics Concepts Worksheet
Research Design and Statistics Concepts Worksheet University of Phoenix Managerial Decision Making MBA 510 G. Mark Waltensperger April 2, 2008 Research Design and Statistics Concepts Worksheet Concept Application of Concept in Scenario Reference to Concept in Reading Concepts of validity, reliability and practicality. Research must be valid and reliable. Validity insures that what is being measured is actually being measured. With out reliability and validity the research becomes questionable and is no longer a good
Rating:Essay Length: 1,056 Words / 5 PagesSubmitted: July 1, 2011 -
Research Design And Statistics Concept Worksheet
Research Design and Statistics Concept Worksheet Name University of Phoenix Research Design and Statistics Concepts Worksheet There are three major criteria for evaluating a measurement tool: validity, reliability, and practicality. • Validity refers to the extent to which a test measures what we actually wish to measure. • Reliability has to do with the accuracy and precision of a measurement procedure. • Practicality is concerned with a wide range of factors of economy, convenience, and
Rating:Essay Length: 572 Words / 3 PagesSubmitted: July 10, 2011 -
Regression Model
2 Methode 2.1 Het lineaire regressiemodel Het lineaire regressiemodel wordt veel gebruikt binnen de economische wetenschap om situaties of gebeurtenissen te verklaren of te voorspellen. De relaties tussen verschillende variabelen worden door toepassing van dit regressiemodel verklaard. Wiskundig gezien wordt het lineaire regressiemodel als volgt weergegeven: Yt = О± + ОІxt + ut. Y is de afhankelijke variabele, de onafhankelijke en verklarende variabele is x, О± is een constante, ОІ geeft de helling van de
Rating:Essay Length: 553 Words / 3 PagesSubmitted: July 15, 2011 -
Research Design And Statistics Concepts Worksheet
Research Design and Statistics Concepts Worksheet Senthil Kumar University of Phoenix Research Design and Statistics Concepts Worksheet Concept Application of Concept in Scenario Reference to Concept in Reading Levels of Measurement: There are four different levels of measurements: 1. Nominal 2. Ordinal 3. Ordinal. 4. Interval. 5. Ratio. These different levels of measurement useful in business. New board member and statistician Bea Hansen pointed out that the data collected from the focus groups and online
Rating:Essay Length: 841 Words / 4 PagesSubmitted: July 19, 2011 -
Regression
As our research comes to a close regarding the Wage Data Set that we have used throughout our research courses we take a closer look at two areas that need to be considered: Years of Experience versus Annual Income throughout the clerical industry. We have compared these two areas using tubular graphs and as our research techniques improve we will be using the linear graph, showing either an increase in pay of a decrease in
Rating:Essay Length: 665 Words / 3 PagesSubmitted: July 19, 2011 -
Applied Statistics
Name: Amr Mohamed Badawy Course: Applied Statistics Assignment Submitted to: DR.Alaa Ibrahim Theoretical Questions Question 1 : Define the Following terms briefly : 1. The Central Tendency measures : * Used To summarize a large no of data with one value which is the central value. 1. The Dispersion measures : * To measure the distance between the observations and the central point. For example Standard deviation. 1. The first quartile : * The first
Rating:Essay Length: 1,065 Words / 5 PagesSubmitted: August 14, 2015 -
Discrimination in Statistics
MAT 209: Discrimination Case Study For class on Friday, September 25th work through this case study. Come with answers to Questions 1-6 ready to turn in at the beginning of class. This case study is based on a scenario involving an alleged case of discrimination privileging White non-Hispanics over Hispanics in the allocation of funds to over 250,000 developmentally-disabled California residents. Background Information Most states in the USA provide services and support to individuals with
Rating:Essay Length: 2,440 Words / 10 PagesSubmitted: September 25, 2015 -
Multiple Regression Analysis on Store Sites
THE USE OF MULTIPLE REGRESSION ANALYSIS IN LOCATING NEW STORE Feifei Chen U28093738 Boston University Abstract: The purpose of this analysis is to build two models in that can predict the sales using data from current store based on statistical and managerial tools and then to interpret and summarize the results of the models to provide managerial recommendations. One such the powerful instrument is multiple regression analysis. Review: The multiple regression model studies the linear
Rating:Essay Length: 1,176 Words / 5 PagesSubmitted: October 28, 2015 -
International Students Statistics in America
When you walk in the school, you have probably seen many international students. Actually, there are so many international students in America. According to the statistic, in between 2011-2012, there were about 764 thousand international students in America. You might think what their purposes of studying abroad to America are. Some people would come to here to establish their great career. Some people might come to here to make their dream come true. A few
Rating:Essay Length: 703 Words / 3 PagesSubmitted: November 11, 2015 -
Regression
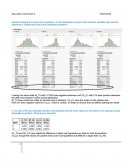
Ajay Lakhe_Homework 3 05/07/2014 Develop histograms for each of the predictors. Do the distributions of each of the predictor variables have extreme skewness or outliers that could cause estimation problems? Looking into above data NI_TA with -0.7832 have negative skewness and CA_CL with 0.74 have positive skewness, the other two predictor’s looks normal distribution. NI_TA have numerous outlier on the both side of whiskers. CA_CL have few outlier on the positive side. Row 231 show
Rating:Essay Length: 436 Words / 2 PagesSubmitted: January 8, 2016 -
These Detailed Statistics Relating to the Gambling Industry in Great Britain Have Been Collated by the Gambling
Industry Statistics April 2010 to March 2015 ________________ Gambling industry data 5 Betting 9 Bingo 16 Casinos 20 Arcades 26 Gaming machine manufacturers 29 Remote betting, bingo and casino 32 Large society lotteries 39 The National Lottery 42 Additional data about the Commission’s activities 44 Appendix 1: Regulatory returns analysis (methodology) 48 Appendix 2: Terminology 49 Appendix 3: Gaming machine categorisation 50 ________________ Preface 1. These detailed statistics relating to the gambling industry in Great
Rating:Essay Length: 10,526 Words / 43 PagesSubmitted: January 26, 2016 -
Business Statistics Terms
Descriptive statistics – methods that help collect, summarize, present and analyze a set of data Inferential statistics – methods that use the data collected from a small group to draw conclusions about a larger group Population – everything we are interested about which you want to draw a conclusion Sample – part of a population (a portion) Parameter – describes a characteristic of a population Statistic – measure that describes a characteristic of a sample
Rating:Essay Length: 515 Words / 3 PagesSubmitted: February 16, 2016 -
Statistics
TRABALHO PRÁTICO DE ESTATÍSTICA DESCRITIVA FASE B LIVROS E MÉDIA DAS CLASSIFICAÇÕES OBTIDAS ÍNDICE 1. Introdução 2 2. Metodologia 3 3. Variável Discreta 4 4. Variável Contínua 9 5. Relações entre as duas variáveis 14 6. Conclusão 18 7. Anexo INTRODUÇÃO No âmbito da cadeira de Estatística I realizámos este trabalho, que tem como objetivo aprofundar os conhecimentos desenvolvidos no campo da estatística descritiva. Utilizámos duas variáveis estatísticas, uma contínua e uma discreta, ambas em
Rating:Essay Length: 2,513 Words / 11 PagesSubmitted: March 6, 2016 -
Not Another Statistic
Not Another Statistic Up until two days earlier, I had never heard of Von Hippel Lindau, hemangiomas, contrast MRI’s, cold PDT lasers, or angiograms. If I were to fast forward two days later, these words would all become routine vocabulary amidst the backdrop of worry Von Hippel Lindau paints. On the first day of October, I got yanked out of school to visit the Children’s Healthcare center at Town Lake for something called an
Rating:Essay Length: 769 Words / 4 PagesSubmitted: March 12, 2016 -
Statistical Variables
1. Statistical variables can be: 1. Discrete quantitative variables measured on a report scale 2. Continuous qualitative variables measured on a report scale 3. Quantitative variables measured on a nominal scale 4. Discrete quantitative variables measured on a nominal scale 5. Continuous qualitative variables measured on a report scale 1. If in a series data a number of large values predominate then: 1. the distribution shows negative asymmetry 2. the modal value is less than
Rating:Essay Length: 623 Words / 3 PagesSubmitted: March 22, 2016 -
Statistic
SUMMARY OUTPUT Regression Statistics Multiple R 0.5992984 R Square 0.3591586 Adjusted R Square 0.3430165 Standard Error 0.0440354 Observations 408 ANOVA df SS MS F Significance F Regression 10 0.4314 0.0431 22.2498 5.12098E-33 Residual 397 0.7698 0.0019 Total 407 1.2013 Coefficients Standard Error t Stat P-value Lower 95% Upper 95% Intercept 0.1257 0.0658 1.9101 0.0568 -0.0037 0.2550 D/P 0.0348 0.0292 1.1911 0.2343 -0.0226 0.0922 E/P 0.0513 0.0249 2.0635 0.0397 0.0024 0.1002 b/m -0.1690 0.0380 -4.4430 0.0000
Rating:Essay Length: 821 Words / 4 PagesSubmitted: April 1, 2016 -
Introduction to Statistical Process Control
BJMQ3013 QUALITY MANAGEMENT A151 1.0 INTRODUCTION TO QUALITY There are many variations in the definition of quality, but they generally fall into two categories. The first is design quality and the second is conformance quality. Quality of design is the quality which the producer or supplier is intending to offer to the customer. When the producer is making the quality of design of the product, he should take into consideration the customer's requirements in order
Rating:Essay Length: 22,841 Words / 92 PagesSubmitted: May 15, 2016 -
Inferential Statistics and Findings
Inferential Statistics and Findings Monica Bright QNT 561 May 2, 2016 Dr. Marlene Casel ________________ Inferential Statistics and Findings The hypothesis testing procedure assists in identifying whether a particular claim about a population is true or false based on a particular sample size. In the Week 2 team paper we discussed potential variables that my effect the employees. An independent variable may include corporate demographics and a dependent variable may include the morale of the
Rating:Essay Length: 262 Words / 2 PagesSubmitted: May 16, 2016 -
Statistics
Chapter 13 1. a) From the problem, the given data is The sample mean treatments for A,B and C are = 156 = 142 = 134 Number of treatments, k = 3 == = 6 = = 6 + 6 + 6 = 18 The formula for the overall sample mean is = = = 14 The sum of squares between treatments is SSTR = = 6(156 – 144)2 + 6(142 – 144)2 + 6(134
Rating:Essay Length: 1,756 Words / 8 PagesSubmitted: November 2, 2016 -
Statistical Assessment on the Use of Crushed Oyster (crassostrea Iredalei) Shell as an Additive Material for Concrete
PLM_header_logo Chapter 1 THE PROBLEM AND ITS BACKGROUND Introduction Enormous amounts of oyster shell have been disposed of by farmers and consumers in the Philippines every year. According to Fisheries and Agriculture Organization of the United Nations, the Philippines have produced an estimated 36 million metric ton of oyster by the year 2010 [1]. With this amount of oyster produced, almost the same amount of oyster shell is wasted. Being surrounded by bodies of water,
Rating:Essay Length: 5,846 Words / 24 PagesSubmitted: November 18, 2016 -
Linear Regression
Simple Linear Regression Reression Problems with Solutions Linear regression and modeling problems are presented. The soluti ons to these problems are at the bottom of the page. If the plot of n pairs of data (x , y) for an experiment appear to indicate a "linear relationship" between y and x, then the method of least squares may be used to write a linear relationship between x and y. The least squares regression line is
Rating:Essay Length: 468 Words / 2 PagesSubmitted: November 28, 2016 -
7.2 Quo 510 Statistics A-Cat
In order to perform the statistical analysis for the sales of refrigerators and transformers required we will use Analysis of Variance (ANOVA) and regression analysis for future production. By doing the test of independence we determine that the required transformers are dependent of the sale of refrigerators. The regression analysis will dictate how much the sale of refrigerators impact the number of transformers required, the difference in sale of refrigerators will explain the variations. Based
Rating:Essay Length: 768 Words / 4 PagesSubmitted: January 1, 2017 -
Regression Analysis of Television Channels
Table of Contents Introduction Processing the dataset ▪ The Dataset ▪ Descriptive Statistics ▪ Null Hypothesis Testing ▪ Correlation between the Variables ▪ Regression Model of the Dataset ▪ Residuals Testing ▪ Predicting with regression model Conclusion - Key findings Table of Figures: Figure 1: Sale Price vs. Market Retail Sales Figure 2: Sale Price Vs. Market Buying Income Figure 3: Sale Price Vs. TV Homes per Station Figure 4: Sale Price vs. Network Hourly
Rating:Essay Length: 3,535 Words / 15 PagesSubmitted: January 5, 2017 -
Business Statistics
INTEGRATED MARKETING COMMUNICATION Case Study for question 1 and 2: 1. Explain various elements of promotion mix that you will use for newly launched product “Lite Air Fryer”. The price of product is Rupees 8000/-. The USP of the product is that it consumes 80% less oil when compared with traditional method of frying. The company is offering 5 years warranty on the same. Some additional features are: • Timer with ready signal and auto
Rating:Essay Length: 1,294 Words / 6 PagesSubmitted: February 27, 2017
